Ofgem's latest cap pushes typical annual bills up 4% from October, driven by higher wholesale gas costs linked to the US-Israel war with Iran.
Typical annual energy bills are rising by £60 to £1,723 at the start of October under regulator Ofgem's latest energy price cap.
The increase of around 4% in the cap affects millions of people in England, Scotland and Wales. It reflects higher wholesale gas costs, which have been pushed up by the US-Israel war with Iran.
Photo series
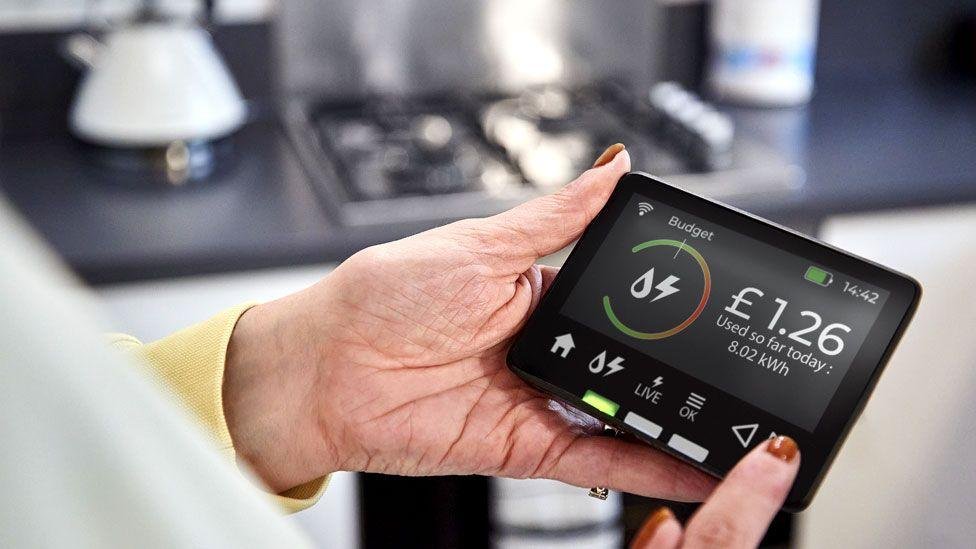
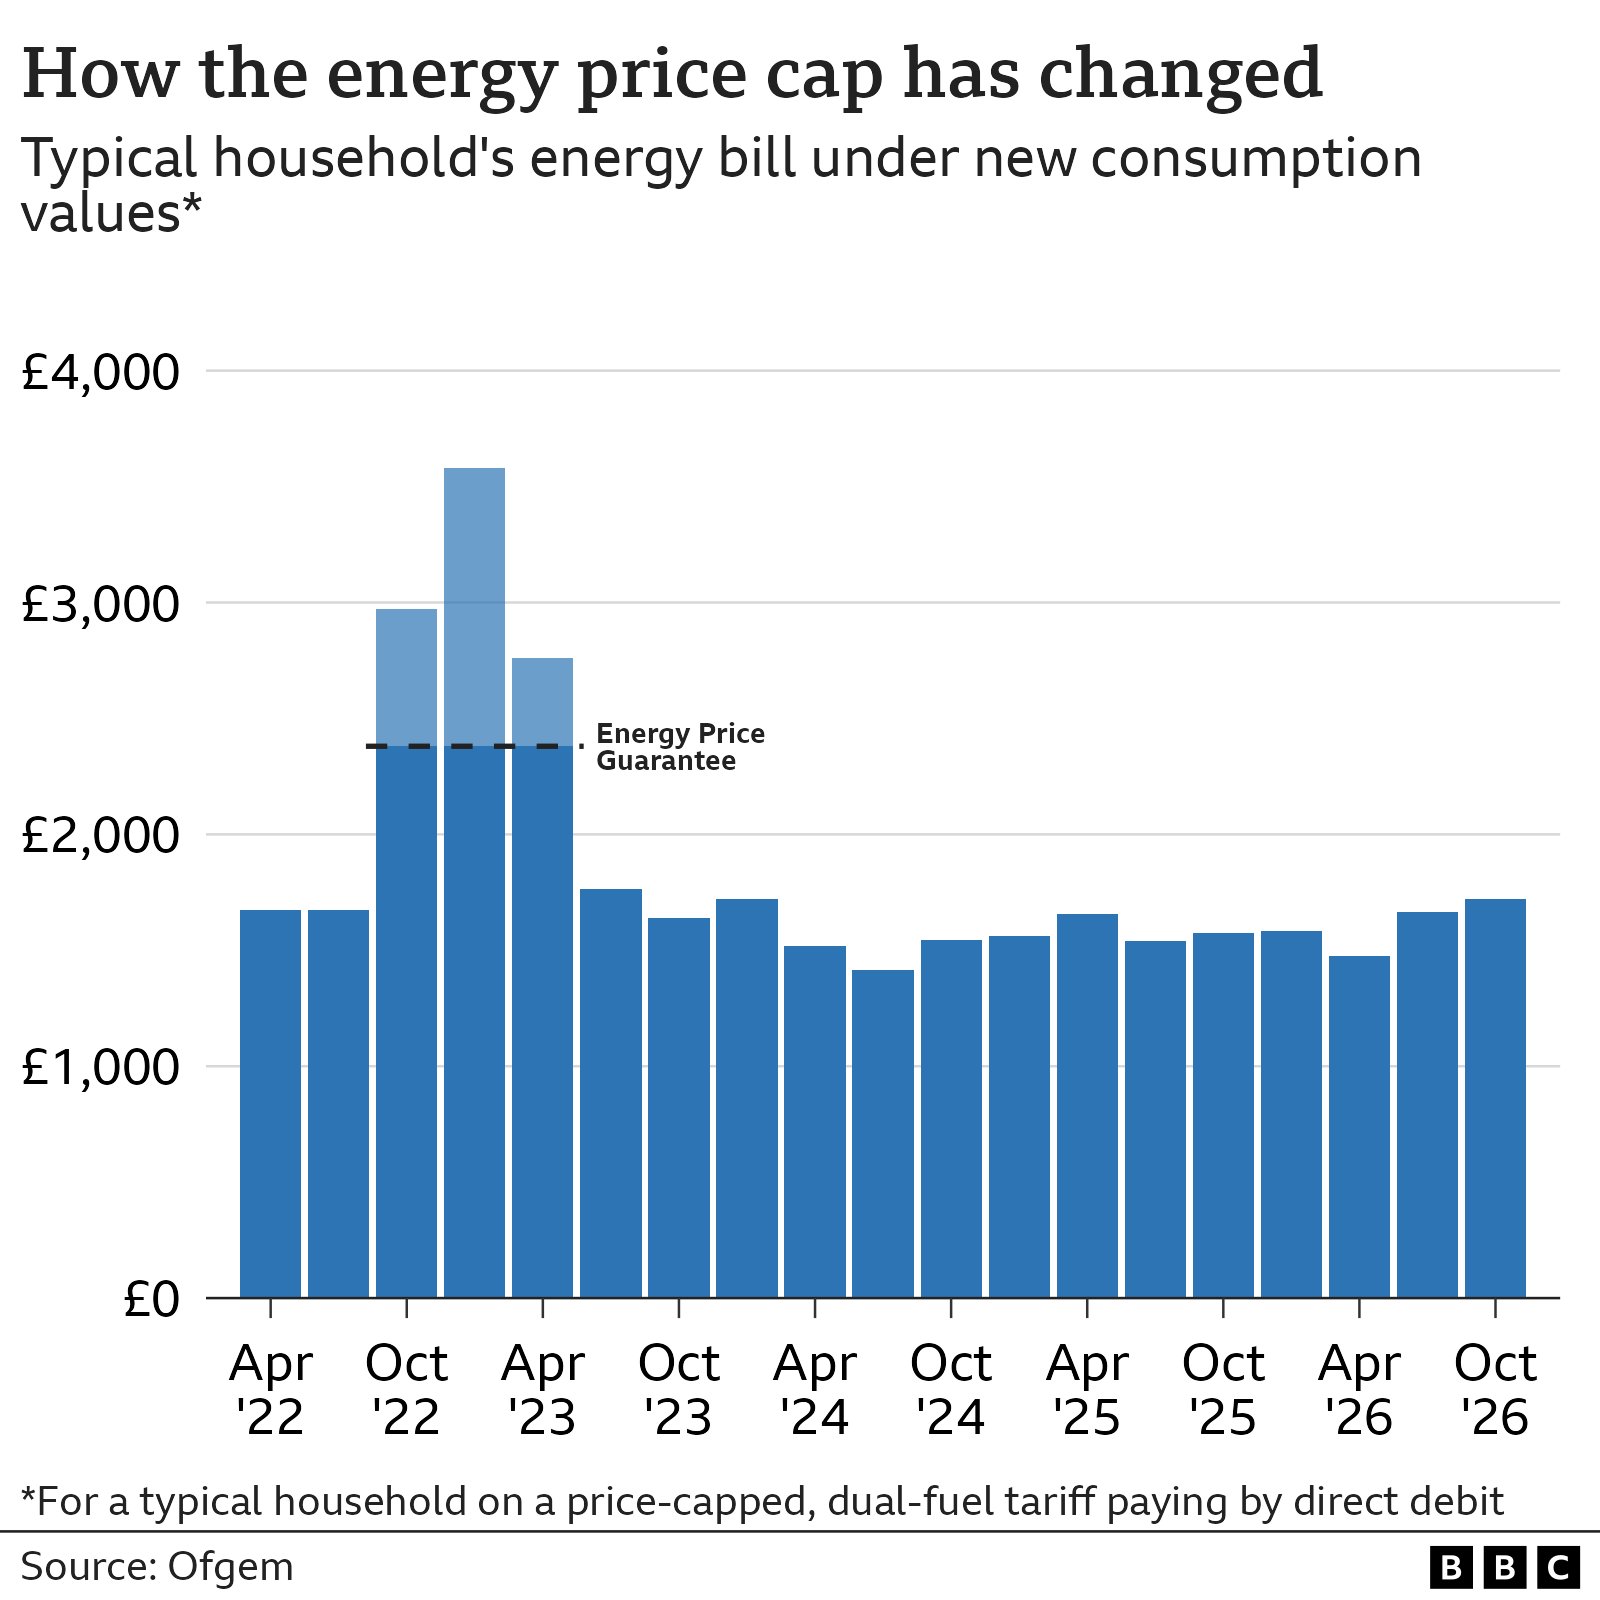
A woman holds a smart meter device whilst standing in a kitchen.A bar chart showing the energy price cap for a typical household on a price-capped, dual-fuel tariff paying by direct debit, from April 2022 to October 2026. The chart starts with a figure of £1,673 for the first two periods from April to September 2022, rises steeply to a high of £3,582 in July 2023, then falls again to a low of £1,414 in July 2024. The figures then undulate between a low of £1,543 and a high of £1,655 from the period covering October to December 2024 and April to June 2025. They then rise again to £1,584 in January to March 2026 and rise again to £1,663 by July to September 2026.
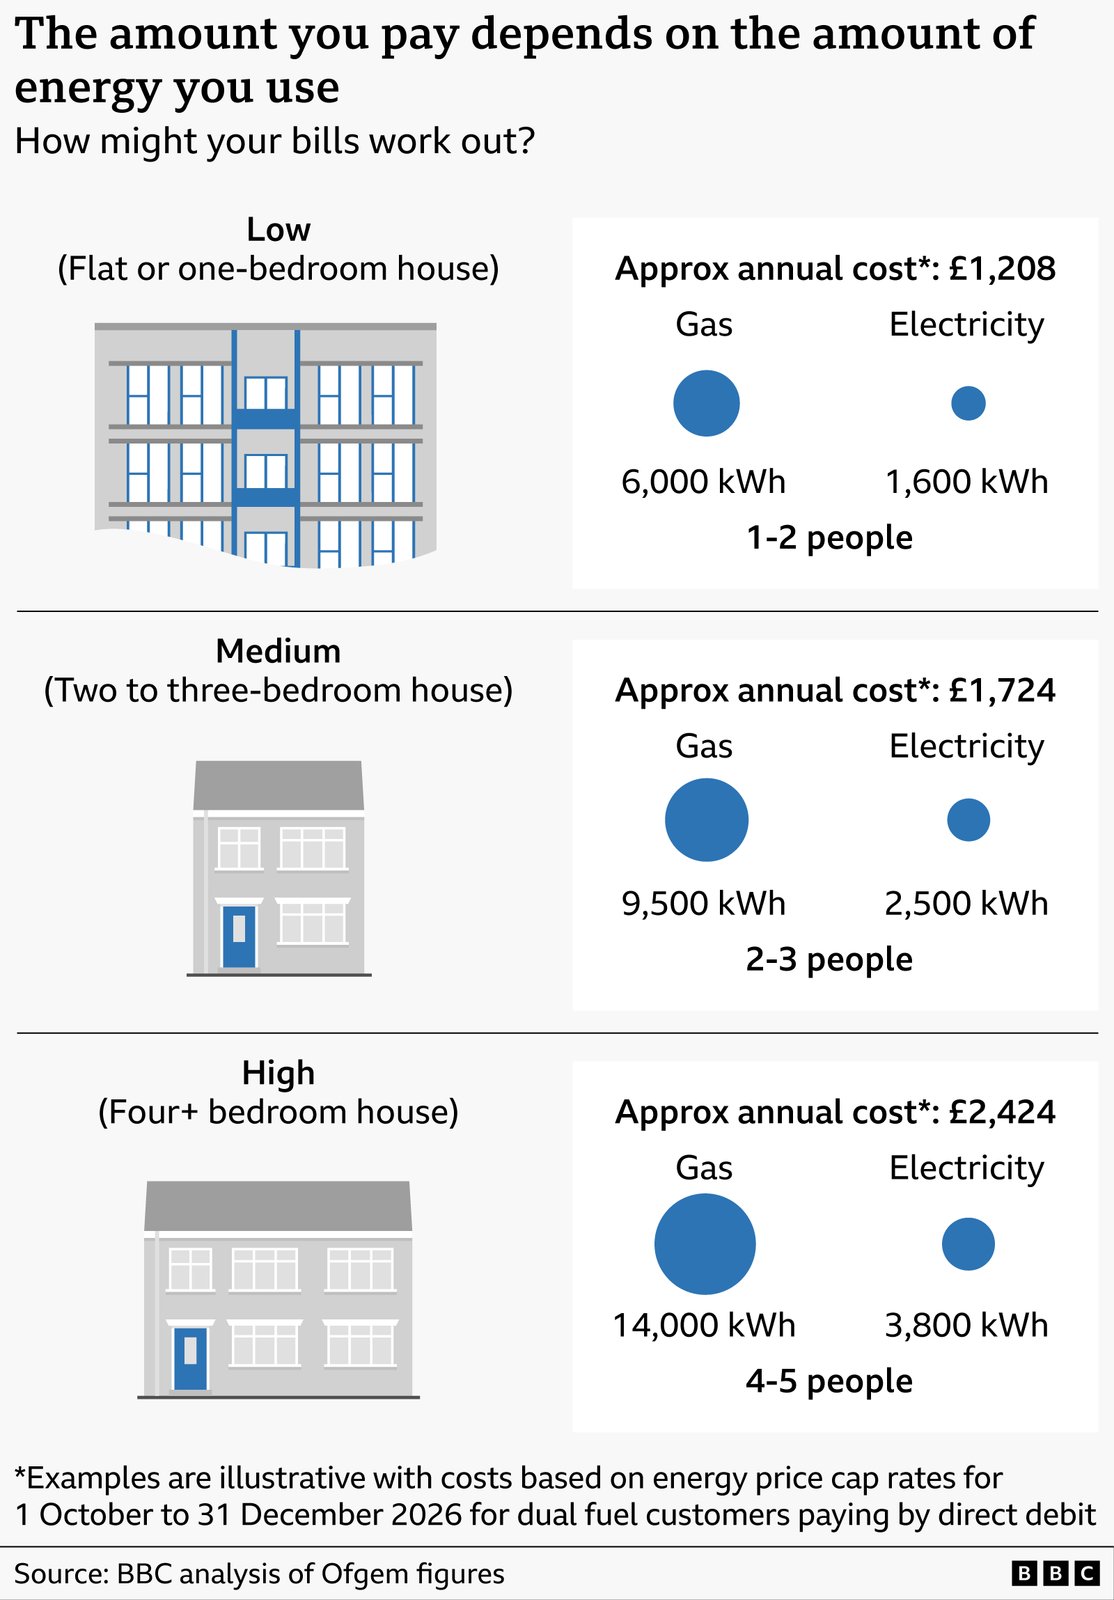
When the new price cap comes into force in October 2026, it will be £1723 under the new typical household consumption values.Graphic explaining how household energy bills vary by usage level. It shows three example household types with estimated annual costs and energy use based on the new typical household energy consumption values, which will be used from July. Low usage (flat or one‑bedroom home): around £1,208 per year, based on about 6,000 kWh of gas and 1,600 kWh of electricity, for one to two people. Medium usage (two to three‑bedroom home): around £1,724 per year, based on about 9,500 kWh of gas and 2,500 kWh of electricity, for two to three people. High usage (four‑plus bedroom home): around £2,424 per year, based on about 14,000 kWh of gas and 3,800 kWh of electricity, for four to five people. The graphic emphasises that costs increase with higher energy use. Figures are illustrative and based on price cap rates for 1 October to December 31 2026. Source: BBC analysis of Ofgem data.Your Voice banner image. Your Voice is written in white against a purple background.
For households on variable tariffs, the advice is straightforward: give an accurate meter reading. With forecasts pointing to significant increases in bills to come, it is also worth preparing for a more expensive winter.
The energy cap fixes the maximum amount customers on standard variable tariffs can be charged for each unit of gas and electricity used. It covers more than 20 million households in England, Wales and Scotland and is set by the regulator Ofgem every three months.
The cap affects people paying by direct debit, by standard credit (when they pay after receiving a bill), or by prepayment meter in slightly different ways.
Most of the increase in the energy price cap is driven by higher gas prices. Gas bills are rising by 8%, which means households that do not use gas will see an energy bill increase of less than 1%.
The government's decision to remove VAT from domestic electricity bills has also affected the new price cap. Ofgem says the typical annual bill would have been £45 higher without that cut.
While Ofgem's director general for markets Neil Kenward said the price rise for October to December was technically 3.6%, Ofgem always rounds the number, which is why it publicised the 4% figure.
The typical annual usage figure applies to dual-fuel households on a standard variable tariff who pay by direct debit. But customers' actual bills depend on the amount of energy used and how they pay for it.
Source: BBC Business — https://www.bbc.co.uk/news/articles/cdd29v8mp9jo?at_medium=RSS&at_campaign=rss
 Pocket Robot